matplotlibのメモ
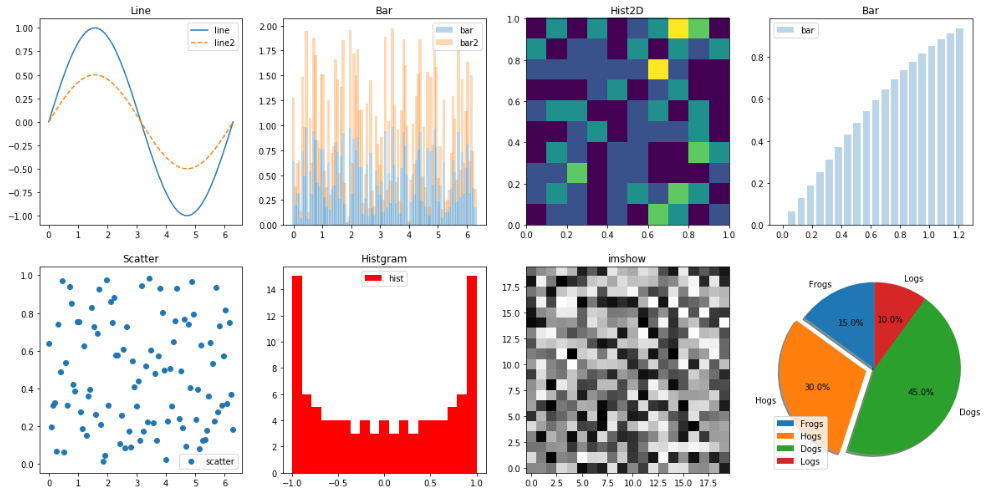
チュートリアルやリファレンスで試してみたひと通りのパターン
jupyterでとりあえず書いてみた
ソース
%matplotlib inline # jupyter用

import matplotlib.pyplot as plt
import numpy as np

x = np.linspace(0, 2*np.pi, 100)
y1 = np.sin(x)
y2 = np.random.rand(100)
y3 = x * 0.5
grid = np.random.rand(2, 100)
grid2 = np.random.rand(20, 20)


# Graph w/ pyplot
## Create Figure & Aexes
fig1, ax1 = plt.subplots(2, 4, figsize=(20,10)) # 最初の2つの引数で1つはグラフの数と並びを指定できる(省略可)

## Plot data
ax1[0][0].plot(x, y1, label='line', ls="-") # Line
ax1[0][0].plot(x, y1/2, label='line2',ls="--") # Line
ax1[0][0].set_title("Line")
ax1[0][0].legend()

ax1[0][1].bar(x, y2, width=0.1, label='bar', alpha=0.3) # Bar
ax1[0][1].bar(x, y2, width=0.1, bottom=y2, label='bar2', alpha=0.3) # Stacked Bar
ax1[0][1].set_title("Bar")
ax1[0][1].legend()

ax1[0][2].hist2d(grid[0], grid[1], bins=[10, 10], range=[[0,1],[0,1]], cmax=None, cmin=None)
ax1[0][2].set_title("Hist2D")

ax1[0][3].bar(x[:20], y1[:20], width=0.05,label='bar', alpha=0.3) # Bar
ax1[0][3].set_title("Bar")
ax1[0][3].legend()

ax1[1][0].scatter(x, y2, label='scatter') # Scatter
ax1[1][0].set_title("Scatter")
ax1[1][0].legend()

ax1[1][1].hist(y1, bins=np.linspace(-1, 1, 20),label="hist", color="r" )
ax1[1][1].set_title("Histgram")
ax1[1][1].legend()

ax1[1][2].imshow(grid2, origin="lower", interpolation="none", cmap=plt.cm.gray, aspect="auto")
ax1[1][2].set_title("imshow")


### Pie chart, where the slices will be ordered and plotted counter-clockwise:
labels = 'Frogs', 'Hogs', 'Dogs', 'Logs'
sizes = [15, 30, 45, 10]
explode = (0, 0.1, 0, 0)  # only "explode" the 2nd slice (i.e. 'Hogs')

ax1[1][3].pie(sizes, explode=explode, labels=labels, autopct='%1.1f%%',
        shadow=True, startangle=90)
ax1[1][3].axis('equal')  # Equal aspect ratio ensures that pie is drawn as a circle.
ax1[1][3].legend()

# plt.show() # jupyter利用なので省略
結果
